AI-powered dashboards FOR SMB & SaaS

Turn data noise into clear next steps.

CairnMetrics builds AI-powered dashboards that connect your marketing, sales, finance, and operations data — then surfaces the insights that matter so you know exactly where to focus next.

AI-powered insights Databox Premier Partner Setup in 2-3 weeks
Founder Scorecard Weekly
OverviewMarketingSalesFinance
MRR
$284,100
6.4% vs last mo.
Pipeline
$1.42M
12% QoQ
CAC
$612
+4.1% watch
Net Margin
28.3%
1.7 pts
Revenue vs target last 12 weeks
Revenue Target
W1 W2 W3 W4 W5 W6 W7 W8 W9 W10 W11
Insights
3 new
!
ROAS up 18% on Google Search after creative refresh on Aug 04.
!
CAC rising on Meta Ads cost-per-lead 23% above 90-day median.
i
Pipeline coverage at 3.1x Q4 target. Healthy.
Trusted by growing teams
Kinn — nurture by designSpectro CloudTusk Practice SalesAutoRABIT
Who it's for

Built for the people making the call on Monday morning.

For founders & owners

One number for the business

You want to know in 60 seconds whether the business is healthy. We build that view first.

For marketing leaders

Spend that ties to revenue

Connect the dots from ad spend through MQL, SQL, and closed-won without arguing about attribution.

For RevOps & sales

Pipeline you can trust

Stage conversion, velocity, and aging clean dashboards built on top of HubSpot, Salesforce, or Pipedrive.

The Problem

Your data is everywhere. Your decisions should not be.

Most teams already have the numbers. What they don't have is one clear view of what those numbers mean and what to do about them.

01 / Scatter

Data lives in too many tools

GA4, HubSpot, QuickBooks, Meta, LinkedIn, Stripe, sheets. Every team has their own view and nobody has the whole picture.

02 / Manual

Reporting eats the week

Monday mornings disappear into copy-paste decks. Numbers go stale the moment they're shared. Nobody trusts the spreadsheet.

03 / Fog

No clarity on what to do next

Marketing ROI is unclear. Sales and revenue feel disconnected. Decisions get made on gut feel because the dashboards aren't answering the real questions.

The Solution

One clear view of the numbers that move your business.

We connect your data sources, identify the metrics that matter most, and build Databox-powered dashboards that help your team make smarter growth decisions.

Connect the right sources. GA4, Google Ads, HubSpot, Stripe, QuickBooks, Meta, LinkedIn, Shopify and 100's more.
Define the metrics that matter. Tied to decisions you're actually making, not vanity KPIs.
Automate the reporting. Live Scorecards, alerts, and weekly digests means no more manual updates.
Guide the decisions. A monthly review with our team to translate the numbers into action.
Data sources flow into CairnMetrics
From scattered sources to one clear view: visualize, report, forecast, benchmark.
Sources we connect

Your stack, in one place.

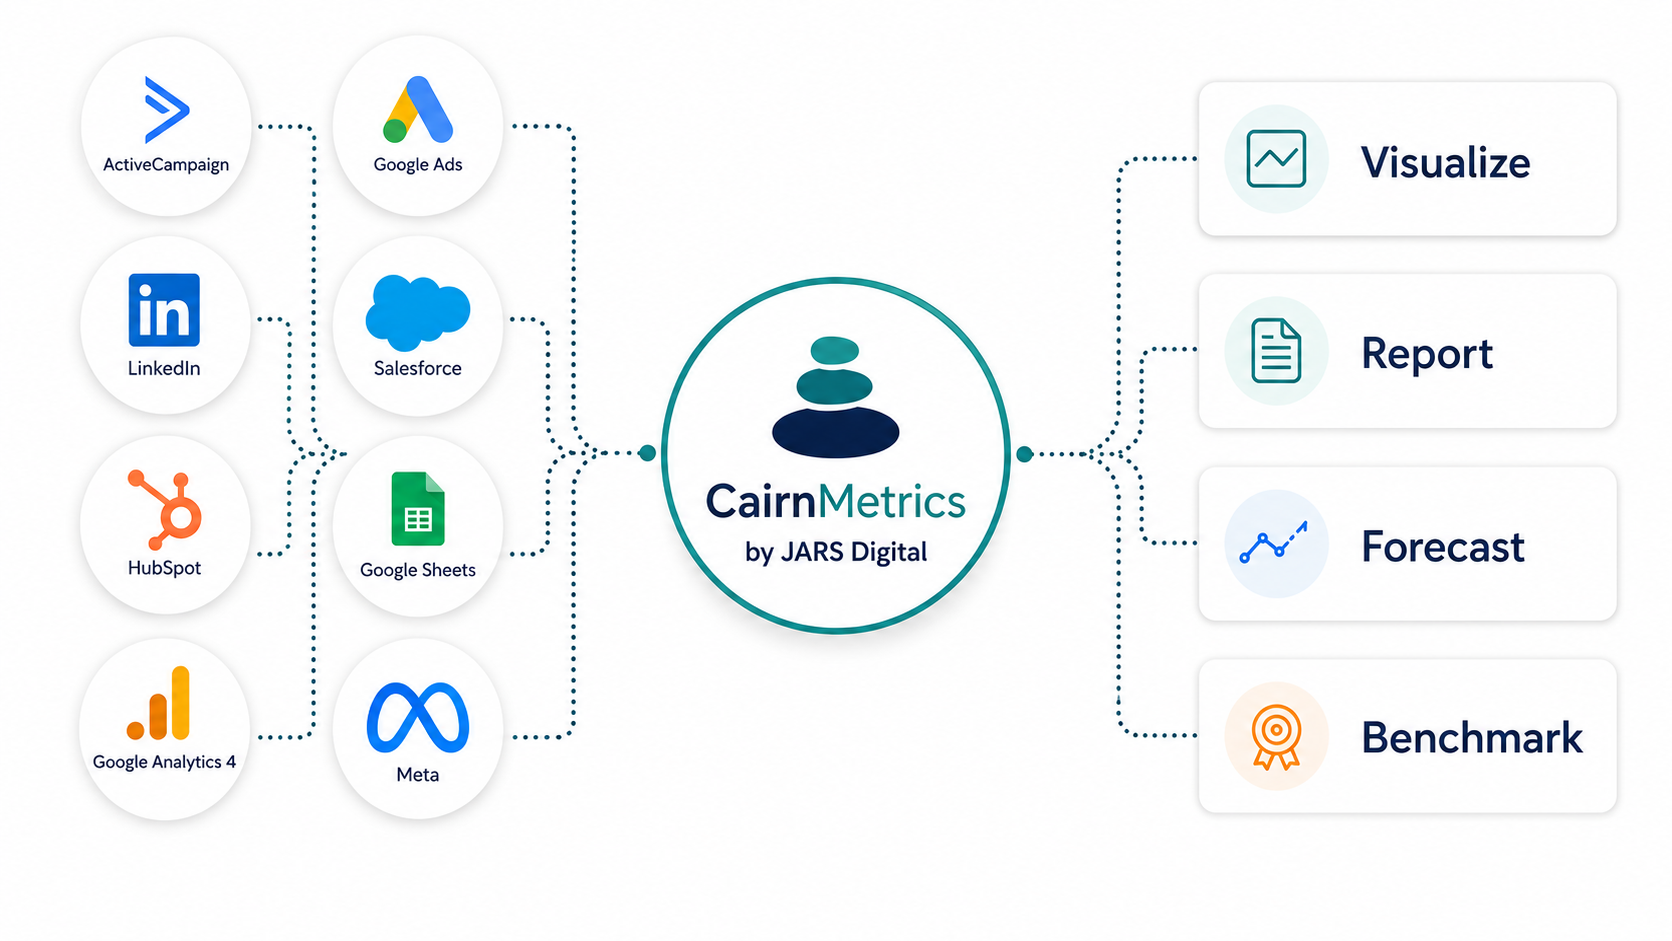
We connect the tools you already use marketing platforms, CRMs, billing, warehouses, and spreadsheets and turn them into a single, trustworthy view.

Cloud integrations

HHubSpot Marketing
HHubSpot CRM
GGoogle Ads
SShopify
FFacebook Ads
FFacebook Pages
AGA 4
LLinkedIn Ads
$Stripe
QQuickBooks
SSalesforce CRM
PPipedrive CRM

Databases & warehouses

BGoogle BigQuery
MMySQL
PPostgreSQL
SSnowflake
AMicrosoft Azure
CGoogle Cloud

Spreadsheets & automations

XExcel
SGoogle Sheets
ZZapier
MMake
DDataddo
+Custom APIs
100+ sources supported through Databox — and our team can build the connectors you don't see here. Talk to us about your stack
AI Analyst

Ask your data anything

Meet Genie — your AI analyst built right into the platform. Ask a plain-language question about your performance and get clear, visual answers in seconds.

Natural language queries. Ask questions the way you think — Genie pulls context from your metrics and dashboards automatically.
Shareable conversations. Send a link to any Genie thread so your team sees the same insights you do.
Learns your business. Teach Genie your KPIs, definitions, and targets so answers are specific to how you operate.
Build from prompts. Create dashboards, metrics, or goals with a simple description — no configuration required.
Skip the dashboard. Explore performance on the fly without building views or setting filters first.
Try Genie Free
Genie AI
What drove the MRR increase this month?

MRR grew 6.4% ($17.1K) month-over-month, driven by three factors:

1. Expansion revenue from 12 upsells ($9.2K)
2. 18 new accounts from Google Ads ($6.1K)
3. Churn dropped to 1.8% (lowest in 6 months)

Based on Stripe, HubSpot, and Google Ads data

Why CairnMetrics

Built by JARS Digital. Powered by practical data expertise.

CairnMetrics is a DBA of JARS Digital, a high-touch business consultancy and fractional CMO agency. We've spent years inside the same tools, ad platforms, and CRMs your team works in every day.

Approach

A cairn marks the path.

A cairn is a small stack of stones left to mark the path. Each stone is a metric placed deliberately, weighted carefully, pointing in one direction. We don't hand you a wall of charts. We hand you the next few stones in the path.

Databox Premier PartnerHubSpot certifiedGA4 specialists
Services

Dashboards built for the way your team actually works.

Not just data, we build visualized reporting systems tied to the decisions you make every week.

Marketing Performance

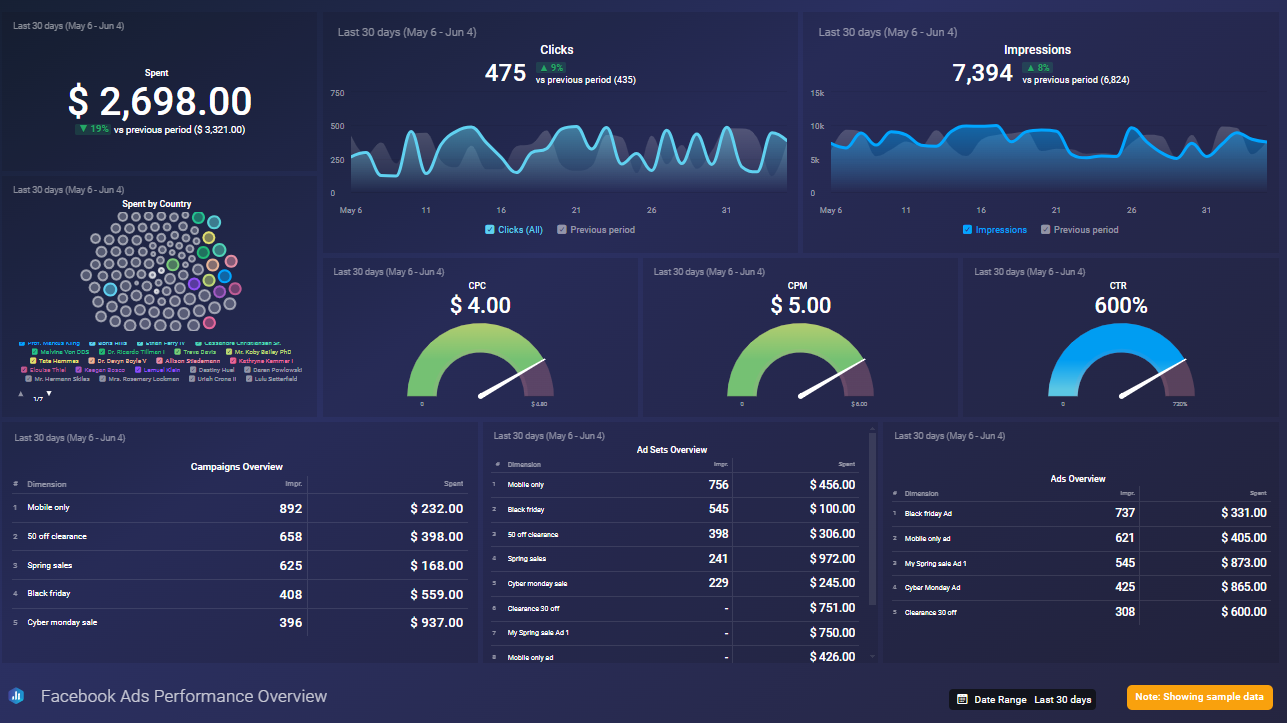
Track campaigns, channels, spend, leads, CAC, ROAS, and pipeline impact across paid, organic, and lifecycle.

GA4 · Google Ads · HubSpot · Meta · LinkedIn

Sales & RevOps

Pipeline coverage, conversion rates, sales velocity, opportunity aging, and closed revenue by rep, source, and segment.

HubSpot · Salesforce · Pipedrive · Close

Finance & Operations

Revenue, cash flow indicators, expenses, AR/AP aging, team performance, and operations KPIs finance-grade clarity without finance-team overhead.

QuickBooks · Xero · Stripe · NetSuite

Databox Setup & Optimization

Build, clean up, and improve Databox reporting systems your team will actually use. From a blank account to a finished system.

Implementation · Audit · Training
The Process

From scattered data to a system you actually use in four simple steps.

01

Map the metrics

We start with the decisions you need to make. Then we identify the KPIs behind those decisions.

02

Connect the data

We connect GA4, Google Ads, HubSpot, QuickBooks, Meta, LinkedIn, Stripe, and the rest of your stack.

03

Build the dashboards

Clear Databox dashboards for owners, teams, and departments built around how you actually work.

04

Guide the decisions

Monthly reviews translate the numbers into action, what changed, what matters, and where to focus next.

Dashboard Examples

Realistic dashboards for real businesses.

A few of the dashboard archetypes we build. Each one is tailored to the metrics that matter for the team using it.

Facebook Ads performance — spend, ROAS, CPL, and campaign breakdown.
Paid Media Live Dashboard

Facebook Ads performance — spend, ROAS, CPL, and campaign breakdown.

A real Databox dashboard built for a paid-media team. Spend trends, ROAS, frequency, and per-campaign performance on a single screen so the team knows which campaigns to scale and which to pause before Monday standup.

Users, MRR & pipeline conversion
RevOps Scorecard

Users, MRR & pipeline conversion

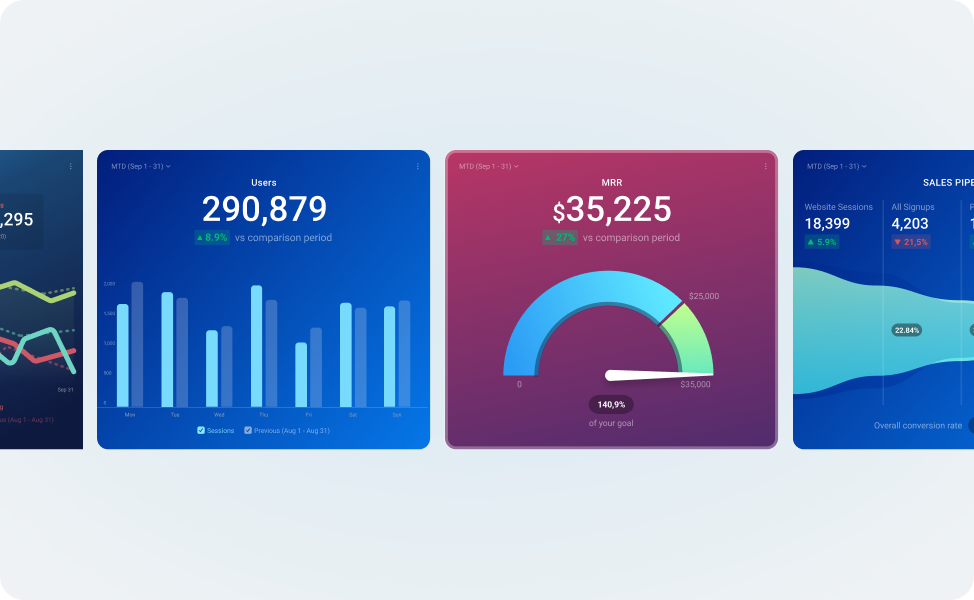
Goal-tracking gauges and trend tiles a founder can read in under a minute.

One place for every connection
Data Connected Sources

One place for every connection

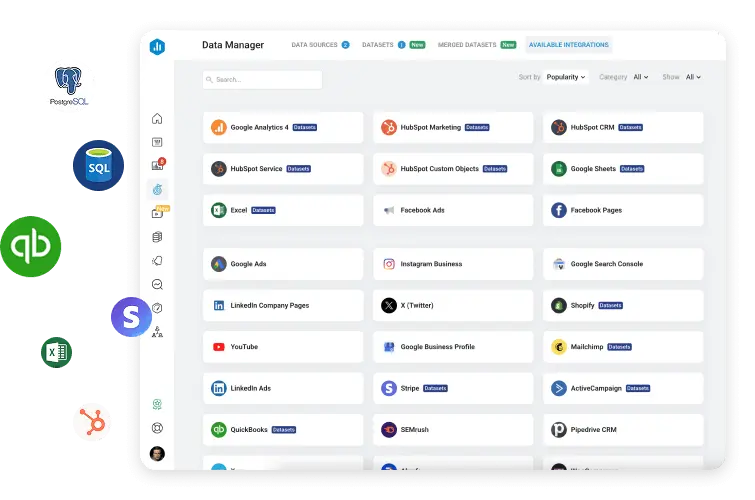
GA4, HubSpot, Stripe, QuickBooks, Shopify, Ads wired in once and kept in sync.

Spend, clicks & conversion overview
BI Overview

Spend, clicks & conversion overview

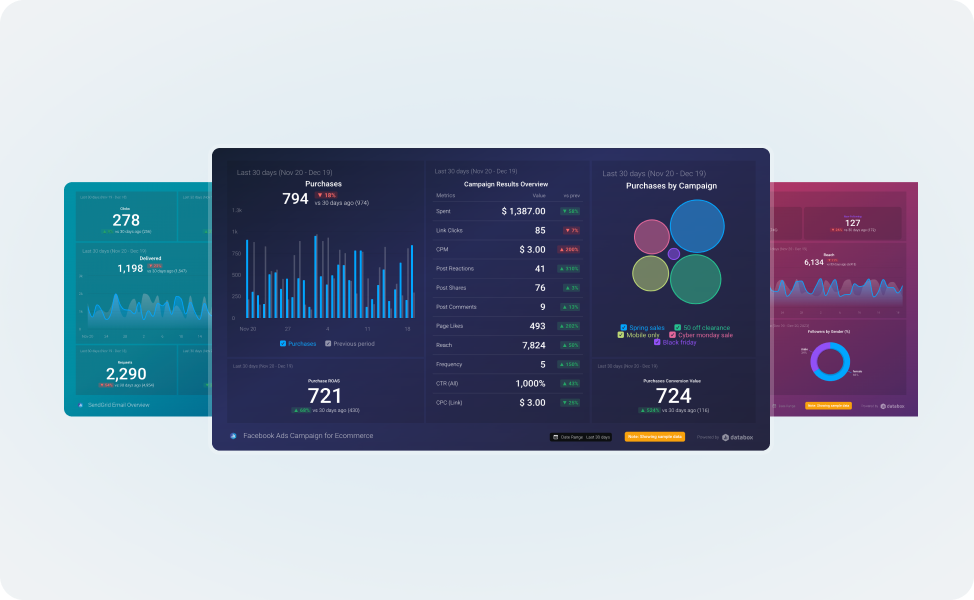
Top-level KPIs, trend lines, and gauges built for paid teams and SMB founders.

Pricing

Clear pricing. No surprise reporting bills.

Three tiers built around how many dashboards, data sources, and decisions you need to support. Pick the one that fits — change anytime.

Starter
For companies that need one clean view of performance.
$500/mo
+ $1,500 one-time setup
  • 1-2 dashboards
  • Up to 3 integrations
  • Automated updates
  • Marketing or owner scorecard
  • Basic KPI setup
  • Monthly dashboard maintenance
  • Email support
Scale
For companies that need visibility across departments.
$2,500/mo
+ $7,500 one-time setup
  • 6-10 dashboards
  • Up to 15 integrations
  • Marketing, sales, finance & ops views
  • Goal tracking
  • Alerts & scorecards
  • Executive reporting
  • Monthly strategy call
  • Ongoing optimization

Databox subscription billed separately unless otherwise noted. Need something custom? Tell us what you're building →

Databox Premier Partner

Top 1% of dashboard builders on the Databox platform.

CairnMetrics is a Databox Premier Partner — the highest partner tier, awarded to agencies with deep product expertise, certified analysts, and a proven track record of building dashboards clients actually use.

We get early access to new Databox features, dedicated partner support, and a direct line to the product team which means your dashboards are built on the best practices and the newest capabilities, not last year's playbook.

Premier
Partner tier
120+
Dashboards shipped
35+
Data sources connected
Get started

Ready to see the metrics that matter?

Book a 30-minute dashboard strategy call. We'll help you identify the dashboards, scorecards, and data sources your business needs most and what to build first.

Free 30-minute call No prep required Reply same day